library(myTridge)
library(rsvd)
library(ggplot2)
library(glmnet)
num.obs <- 500
num.par <- 5000
family <- "gaussian"
data<-myTridge::genDataList(n = num.obs,
mu = rep(0, num.par),
p = num.par,
rho = 0.2,
beta = rnorm(num.par, mean = 0, sd = 1),
SNR = 10,
family = family)
X <- data$normData
y <- data$y
X_new <- cbind(rep(1,num.obs),X)
r <- 0.5 # tuning parameter
tt <- bench::mark(
svd = {
##### the following commands should only be calculated once for all tuning parameters ####
mysvd <- base::svd(X_new) # uses the base implementation of svd
R <- mysvd$u %*% diag(mysvd$d)
RTR <- crossprod(R) # R^TR
IN <- diag(num.obs) # NxN identity matrix
RTY <- crossprod(R,y) # R^TY
#############################################################################################
mysvd$v %*% (solve(RTR + r*IN) %*% RTY) # ridge estimator
},
rsvd = {
##### the following commands should only be calculated once for all tuning parameters ####
mysvd <- rsvd::rsvd(X_new) #uses the rsvd package
R <- mysvd$u %*% diag(mysvd$d)
RTR <- crossprod(R) # R^TR
IN <- diag(num.obs) # NxN identity matrix
RTY <- crossprod(R,y) # R^TY
#############################################################################################
mysvd$v %*% (solve(RTR + r*IN) %*% RTY) # ridge estimator
},
woodbury = {
##### the following commands should only be calculated once for all tuning parameters ####
XXT <- tcrossprod(X_new)
XTY <- crossprod(X_new,y)
IN <- diag(num.obs) # NxN identity matrix
XXTY <- XXT %*% y
#############################################################################################
XTY/r - crossprod(X_new, solve(IN + XXT/r) %*% XXTY) / r^2 # ridge estimator
},
glmnet = {
coef(glmnet(X, y, alpha = 0, lambda = r))
},
check = FALSE,
relative = FALSE
)
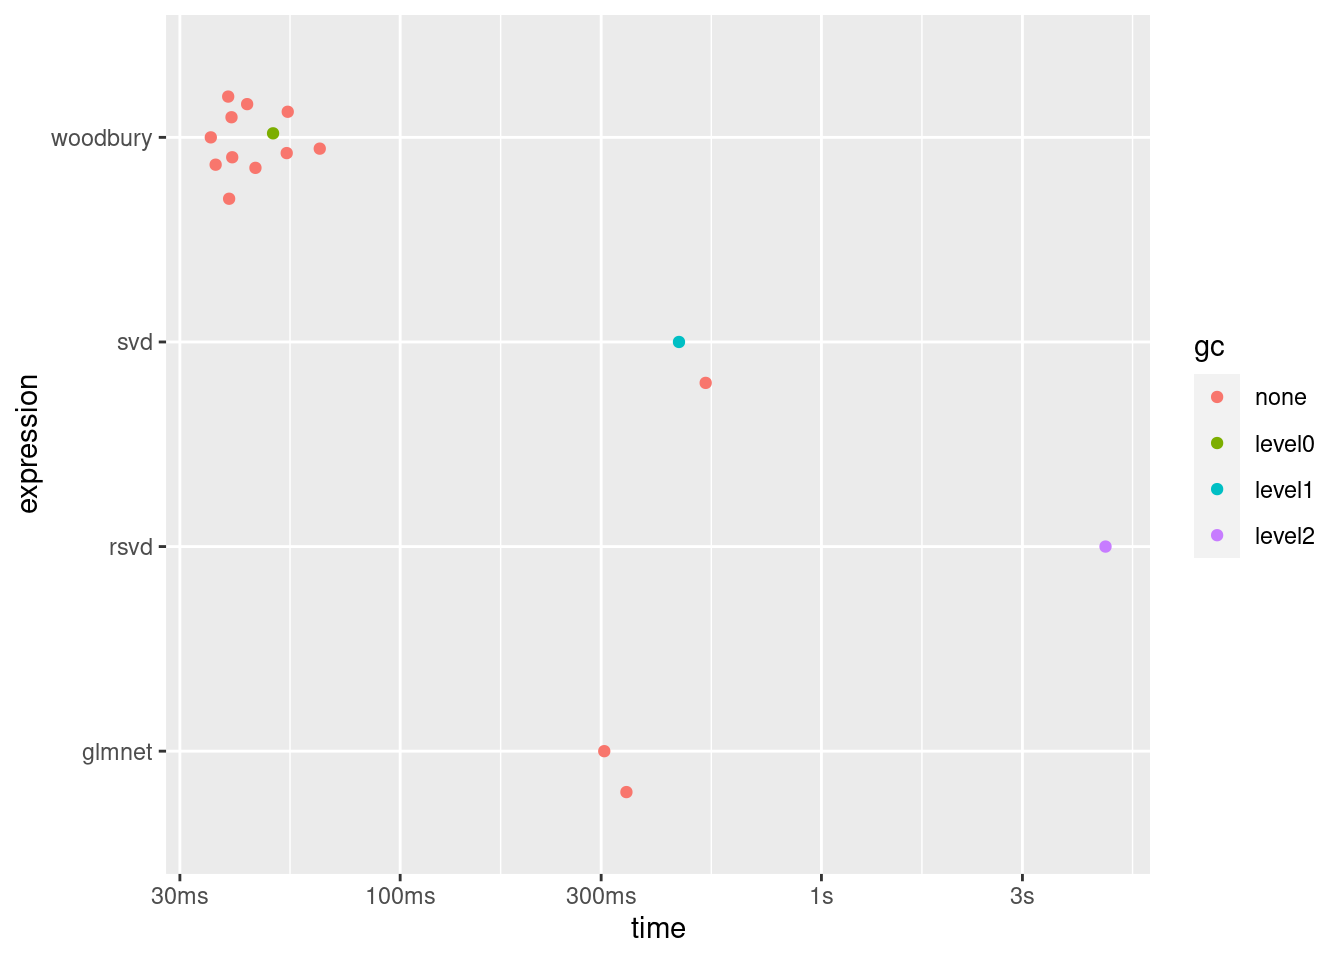
tt
## # A tibble: 4 x 6
##   expression      min   median `itr/sec` mem_alloc `gc/sec`
##   <bch:expr> <bch:tm> <bch:tm>     <dbl> <bch:byt>    <dbl>
## 1 svd        459.04ms  495.1ms     2.02    120.4MB     2.02
## 2 rsvd          4.72s    4.72s     0.212   626.2MB     1.27
## 3 woodbury    35.52ms  41.63ms    22.2      11.6MB     1.85
## 4 glmnet     305.12ms 324.77ms     3.08     59.3MB     0
ggplot2::autoplot(tt)